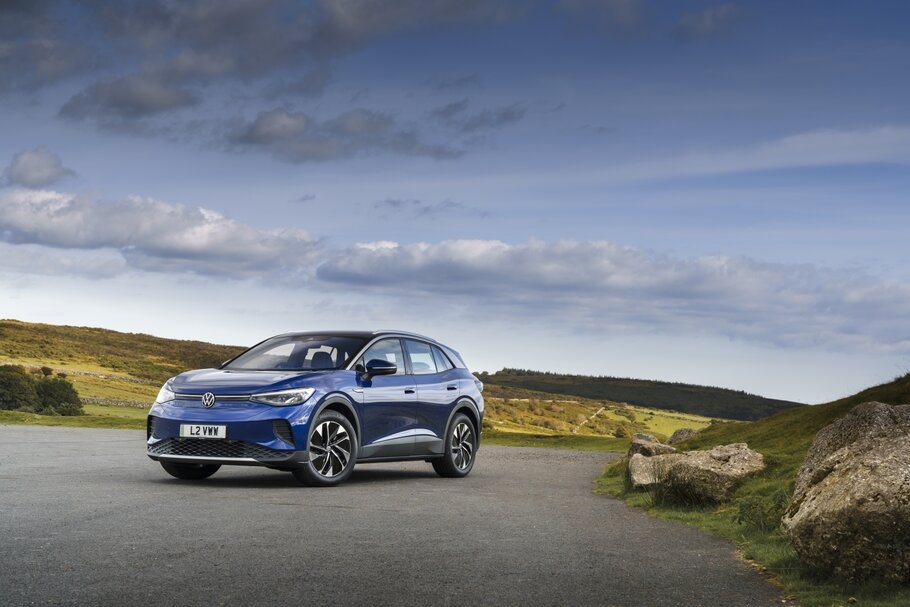
The Volkswagen Group increased its deliveries of all-electric vehicles (BEVs) by 48 per cent year-on-year to 321,600 vehicles in the first half of the year. The BEV share of total deliveries rose to 7.4 per cent, up from 5.6 per cent in the first six months of the previous year. The Group achieved the highest growth in Europe, where deliveries rose by 68 per cent to 217,100 BEVs. Here, the Volkswagen Group is the market leader and gained market share. Significantly more customers of a Group brand took delivery of their all-electric vehicles in the USA, too. The increase here was 76 per cent to 29,800 vehicles. In China, deliveries were around two per cent below the previous year’s level at 62,400 BEVs in a particularly competitive market environment. Recently, however, the trend here has also been positive. Following a lower first quarter, 18 per cent more BEVs were handed over to customers in the world’s largest automotive market in the second quarter than in the prior-year period. Worldwide, the increase in the second quarter was 53 per cent to 180,600 vehicles (118,000), and the BEV share of total deliveries rose to 7.7 per cent (6.0) in this period.
Around 68 per cent of the Group’s BEV deliveries were in its home region of Europe, followed by China with 19 per cent and the USA with nine per cent. Four per cent went to other markets.
The Volkswagen Passenger Cars brand delivered 164,800 vehicles by the end of June, slightly more than half of all BEVs in the Group. It was followed by Audi with 75,600 vehicles (group share 24 per cent), ŠKODA with 31,300 vehicles (group share 10 per cent), SEAT/CUPRA with 18,900 vehicles (group share 6 per cent), Porsche with 18,000 vehicles (group share 6 per cent) and Volkswagen Commercial Vehicles with 12,300 vehicles (group share 4 per cent).
The most successful BEV models in the first half of 2023 were:
- Volkswagen ID.4/ID.5 101,200
- Volkswagen ID.31 49,800
- Audi Q4 e-tron (incl. Sportback) 48,000
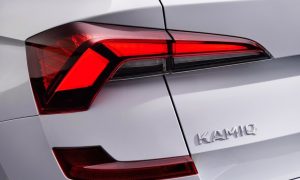
- ŠKODA Enyaq iV (incl. Coupé) 31,300
- Audi Q8 e-tron (incl. Sportback) 19,500
1) ID.3 – power consumption in kWh/100 km: combined 16.5-15.2; CO2 emissions in g/km: combined 0. Only consumption and emission values according to WLTP and not NEDC are available for the vehicle. Consumption and CO₂ emission data with ranges depending on the selected equipment of the vehicle.
Volkswagen Group – Deliveries of battery-electric vehicles (BEV) to customers
|
Deliveries to customers by markets |
Jan. – Mar. |
Jan. – Mar. |
Delta (%) |
Apr. – Jun. |
Apr. – Jun. |
Delta (%) |
Jan. – Jun. |
Jan. – Jun. |
Delta (%) |
|
Europe |
98,300 |
58,500 |
+68.1 |
118,900 |
70,400 |
+68.8 |
217,100 |
128,900 |
+68.5 |
|
USA |
15,700 |
7,900 |
+98.0 |
14,000 |
9,000 |
+55.7 |
29,800 |
17,000 |
+75.5 |
|
China |
21,500 |
28,800 |
-25.4 |
41,000 |
34,700 |
+18.0 |
62,400 |
63,500 |
-1.6 |
|
Rest of world |
5,600 |
4,100 |
+37.1 |
6,700 |
3,900 |
+74.4 |
12,300 |
7,900 |
+55.3 |
|
Worldwide |
141,000 |
99,200 |
+42.1 |
180,600 |
118,000 |
+53.0 |
321,600 |
217,200 |
+48.1 |
|
Deliveries to customers by brands |
Jan. – Mar. |
Jan. – Mar. |
Delta (%) |
Apr. – Jun. |
Apr. – Jun. |
Delta (%) |
Jan. – Jun. |
Jan. – Jun. |
Delta (%) |
|
Brand Group Core |
97,000 |
65,100 |
+49.0 |
130,300 |
82,400 |
+58.2 |
227,300 |
147,500 |
+54.1 |
|
Volkswagen Passenger Cars |
70,000 |
53,300 |
+31.2 |
94,800 |
62,500 |
+51.6 |
164,800 |
115,900 |
+42.2 |
|
ŠKODA |
12,400 |
8,800 |
+40.6 |
18,900 |
13,400 |
+41.3 |
31,300 |
22,200 |
+41.0 |
|
SEAT/CUPRA |
9,200 |
2,200 |
+318.9 |
9,700 |
6,100 |
+60.3 |
18,900 |
8,300 |
+128.7 |
|
Volkswagen Commercial Vehicles |
5,500 |
700 |
+642.2 |
6,900 |
400 |
+1,680 |
12,300 |
1,100 |
+998.6 |
|
Brand Group Progressive |
34,600 |
24,200 |
+42.7 |
41,100 |
25,800 |
+59.2 |
75,600 |
50,000 |
+51.2 |
|
Audi |
34,600 |
24,200 |
+42.7 |
41,100 |
25,800 |
+59.2 |
75,600 |
50,000 |
+51.2 |
|
Lamborghini/Bentley |
– |
– |
– |
– |
– |
– |
– |
– |
– |
|
Brand Group Sport Luxury |
9,200 |
9,500 |
-3.4 |
8,800 |
9,400 |
-6.0 |
18,000 |
18,900 |
-4.7 |
|
Porsche |
9,200 |
9,500 |
-3.4 |
8,800 |
9,400 |
-6.0 |
18,000 |
18,900 |
-4.7 |
|
TRATON |
300 |
400 |
-38.8 |
400 |
400 |
-7.1 |
600 |
800 |
-22.8 |
|
MAN |
150 |
270 |
-44.7 |
250 |
270 |
-7.1 |
400 |
540 |
-26.2 |
|
Volkswagen Truck & Bus |
20 |
110 |
-83.8 |
20 |
0 |
+1,050 |
40 |
100 |
-65.0 |
|
Scania |
70 |
20 |
+208.3 |
70 |
70 |
+9.2 |
150 |
90 |
+62.9 |
|
Navistar |
10 |
20 |
-13.3 |
60 |
100 |
-40.0 |
70 |
110 |
-36.4 |
|
Volkswagen Group (total) |
141,000 |
99,200 |
+42.1 |
180,600 |
118,000 |
+53.0 |
321,600 |
217,200 |
+48.1 |
Previous article
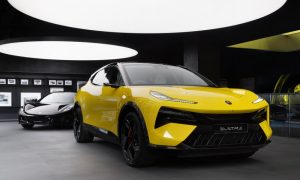
Lotus Eletre first UK customer drives take place